Bearish Divergence on the USDCAD Forex Analysis 12/4/2018
Bearish Divergence on the USDCAD Forex Analysis 12/4/2018
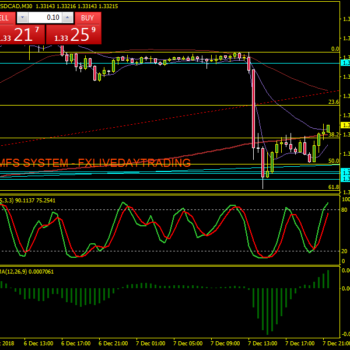
As we have been discussing this week, a break will often follow a retest. The USDCAD a broke the trend line on Monday and retested the trend line today.
If you are a member of our Forex Trading signal and room service you will know we grabbed this trade as it broke lower. We waited patiently on this USDCAD. I will show some basic Forex Analysis here to show you a nice example of a trend line break then a retest. We have had numerous signals of a move lower in the past week with OIL peaking and the divergence showing on both the OIL chart as well as the USDCAD.
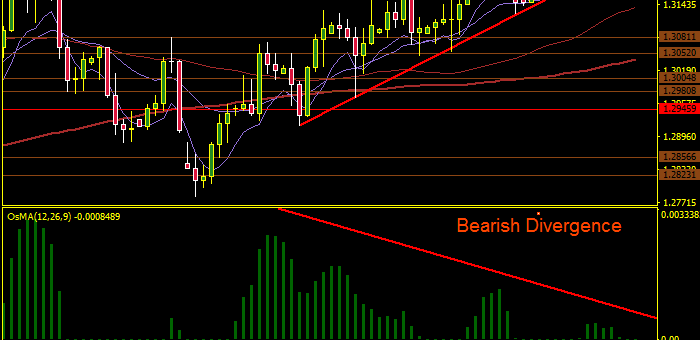
Here is the Forex Trading Divergence signal on the daily USD/CAD chart.

In the above example, notice that the price break followed a aggressive move, this is because the stops were washed below the trend line on this Forex chart. The trading divergence is bearish because price continues to move higher as momentum slowed.
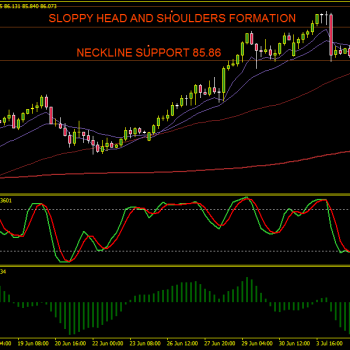
Here is the OIL chart, you will clearly see we had bullish divergence on this chart. The momentum slowed to the downside and the price action began to turn, this is called bullish divergence.
A good assumption to make when you see divergence is not to buy the dip in this particular chart.

- Posted by fx_Trader
- On December 4, 2018
- 0 Comments


0 Comments