USD/CAD Crude Oil Chart Setup – 9-17-2015
USD/CAD and Crude Oil Chart Setup
9-17-2015
Technical Trading Analysis Chart Setup
With several chart patterns coming together in the last 48 hours, it leads us to believe we may see some substance in this move on USD/CAD. From a purely technical standpoint we see USD/CAD breaking out of a 3 week consolidation triangle pattern. These type of patterns are often 'neutral' until broken. We tend to see the moves come after the break. I have noticed false breakouts will also occur, however one extra signal that I often use is to see the commodity correlation to help me decide on my risk and reward for the trade. As you can see the USD/CAD has been moving lower and has found some support at our 1.3165 area, the main event to ve very careful is the FOMC today. This is by far the most important FOMC and many traders are unsure of the direction to take, for this reason we may chop into the FOMC.
Please click on image above to enlarge.
Summary:
Our research team sees the 1.3100 area as getting breached in the next 24 hours if OIL holds its ground or gets stronger in its short term lift off. We see a target if 1.3103 to the downside, and we do not expect a hawkish FOMC announcement today. On the flip side if FOMC is hawkish, we may see the 1.3352 area get cleared as USD/CAD may pop with a drop in oil. We remain short USD/CAD at the moment with a target of 1.3103
Key USD/CAD Key Levels
1.3352 (resistance)
1.3233 (resistance)
1.3161 (support)
1.3075 (support)
Crude OIL Technical Analysis
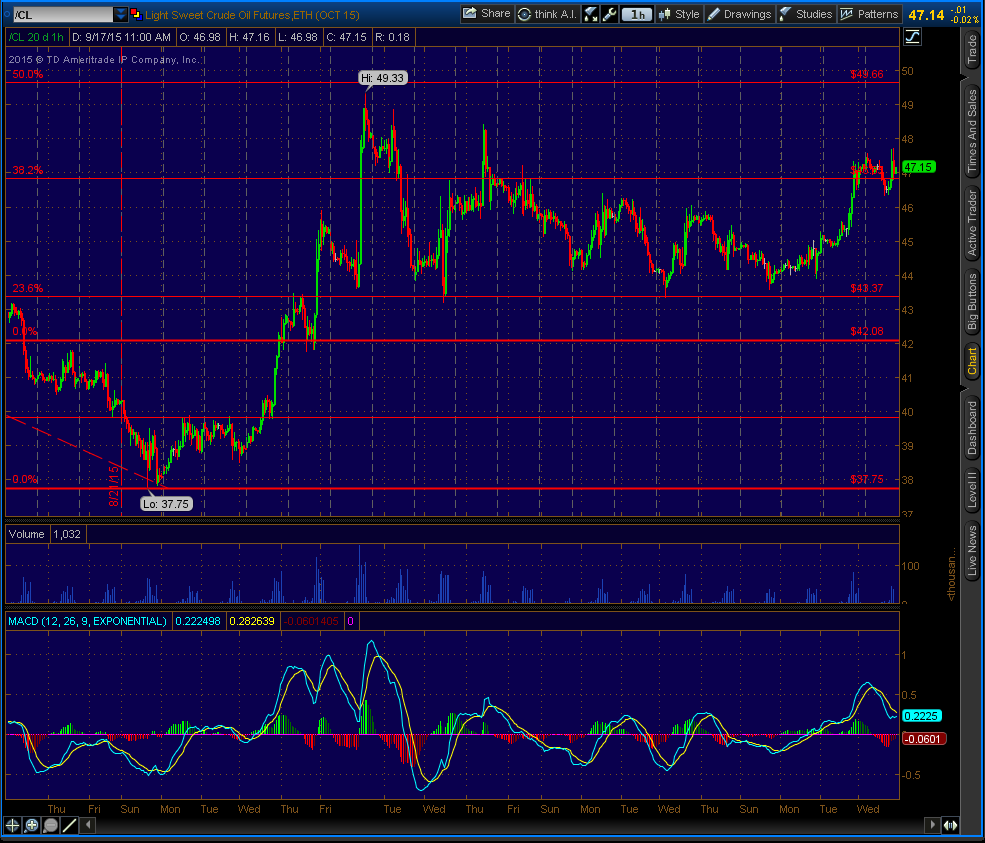
Now let's take a look at Crude oil. We are seeing a strong crude oil going into FOMC, however this may change temporarily, as stops get adjusted to allow big money to take their positions. You will see CRUDE is staying about the 38 fib level at least for now. Where do we go from here? we will await FOMC to get a better idea where we move. With uncertain USD, we may go either way, although we still hold a bullish bias on OIL, as well as a bearish bias on USD/CAD. The move may be short lived if FOMC does not support a 'Dovish' stance on their monetary policy today.
Here is a chart on CRUDE OIL to give you an idea of the current chop. 50 is now the key overhead area for a targeted up move.
Crude OIL Trading Levels
46.78 support
43.59 support
47.71 resistance
50.00 resistance
We wish you the best in trading!
Here is a signal delayed from yesterday that we are posting here on 5:40pm EST on 9-17-2015. You will see the pair came much lower as we expected.
Fxlive Day Trading.com
Independent Research Team
Follow us on twitter.
- Posted by fx_Trader
- On September 17, 2015
- 0 Comments


0 Comments